

Picture an outdoor retailer that launches a new trail running shoe in April. By mid-May, that style is coming back at twice the rate of the rest of the range, and merchandising asks the supplier about a bad batch.
The contact center already knew why. For five weeks, agents had heard “it runs half a size small” on call after call, issued the refund, and closed each ticket as Return – refund processed. Nobody outside support saw that pattern. Retail return call insights close that gap.
In this guide, we look at why return calls go unanalyzed, which patterns matter, how AI does the listening, and how to get findings to the people who can fix the product.
Why Return Calls Are an Underused Signal
Returns are not a rounding error. US retailers expected 15.8% of their 2025 sales to come back, worth $849.9 billion, and the estimate for online sales alone was 19.3%. Many of those returns pass through support.
Yet most contact centers are set up to process returns, not learn from them. Measured on handle time and cost per contact, return calls look like a cost to shrink. That view misses the link between customer experience and revenue.
Where the reason gets lost
- The wrap-up code: Disposition codes record what the agent did, such as a refund or exchange. They rarely record why.
- The return form: Dropdowns push customers toward “Other” or “Changed my mind,” which tells a buyer nothing.
- The recording: Every conversation sits in call recording storage, but no one can listen to thousands of them.
- The survey: Customers rate the refund, often highly, and the product problem stays invisible.
Gartner notes that most business functions don’t use the customer insights their service teams collect. For retailers, the most direct voice of the customer on product quality gets recorded, filed, and forgotten.
What Patterns Are Worth Surfacing
A return form gives you a checkbox. A call gives you the sentence behind it: “the toe box is narrow,” “the blue looked navy online,” “the zipper split on the second wear.”
Shoppers are consistent about what sends products back. A December 2025 KPMG and EHI survey of 500 online shoppers in Germany ranked the following reasons highest:
- Quality defects: 73.8%
- Wrong size: 72.6%
- Product damage: 71.2%
- Inaccurate descriptions or images: 60.4%
The same survey found 36.6% of shoppers hadn’t bought from a retailer again after a bad return experience. Ignoring return reasons costs more than the refund.
Recurring defect types
One broken strap is bad luck. Forty calls about the same strap on the same backpack in three weeks is a supplier or production problem. Watch for one failure point repeating on a single SKU or batch, clustered in time.
Sizing and fit complaints
Fit complaints are useful because they have a direction. “Runs small” across a whole brand suggests the size chart is off. “Tight across the shoulders” on one jacket suggests the cut needs work.
Calls also expose bracketing, where customers order two sizes planning to return one. That’s a sizing-confidence problem that clearer size guidance can reduce.
Misleading descriptions and images
“It looked different on the website” is one of the cheapest return reasons to fix, because the product is fine and the page is wrong. Listen for color mismatches, material surprises, missing dimensions, and features the listing implied.
Damage in transit belongs on the watch list too, though it usually points to packaging or carriers.

How CX Insights Surfaces These Patterns Automatically
Manual review can’t find these patterns reliably. Say a retailer handles 3,000 return-related contacts a week and a QA analyst listens to 30. If 60 contacts mention the same broken strap, the sample will likely catch one of them, or none.
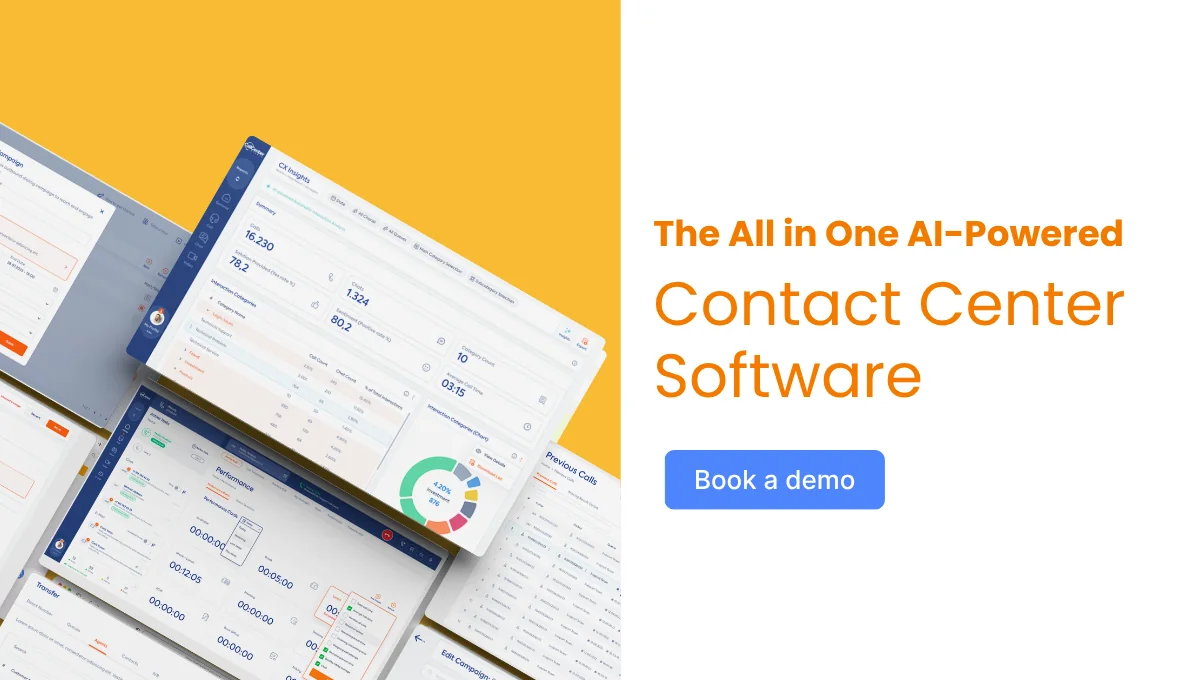
Automated interaction analytics looks at the whole population instead. CX Insights uses AI to analyze customer interactions and break them down by the categories discussed, the solutions provided, and customer sentiment.
It covers calls, email, and chat. On one platform for voice, chat and WhatsApp, a complaint that starts in chat and moves to the phone stays part of the same picture.
Categories instead of wrap-up codes
Interaction categories reflect what was actually discussed. A return call shows up under the topic the customer raised, not the code an agent picked at the end of a long shift.
Trends and filters
Periodic analysis and trend charts show when a topic starts climbing. Customizable filters narrow the view to what you’re investigating, such as the six weeks after a launch. The shoe retailer needed that signal in week two, not week six.
Product names spelled correctly
Transcription tends to mangle brand terms. The AI Dictionary lets you define correct spellings for product names and jargon, so “TrailFlex 3” doesn’t come out three different ways and split one trend into several.
Sentiment as a severity signal
Two topics can have the same volume and very different stakes. Sentiment shows which one is making customers angry, which is why sentiment analysis matters in customer support when you’re deciding what to escalate first.
Getting This Data to the Teams Who Can Act on It
Surfacing a pattern is half the work. Treating customer service data as product feedback only pays off when the finding reaches someone who can change a size chart, a supplier order, or a product page.
| Pattern | Team that owns the fix | What to send | When |
| Recurring defect | Product quality, sourcing | SKU, failure point, weekly volume, transcript excerpts | As soon as a spike appears |
| Sizing and fit | Merchandising, product development | Direction of the complaint, affected sizes | Weekly after a launch, then monthly |
| Misleading description | Ecommerce content | The phrases customers used, the listing element they misread | Before the next content refresh |
| Damage in transit | Logistics, fulfillment | Carrier, packaging type, region | Monthly |
Keep it short for the merchandising team. A merchandiser doesn’t need sentiment curves. They need “Style 4417: 38 fit complaints in two weeks, most say it runs small, here are five quotes.”
Move the data where product teams already work
With Call Center Studio’s monitoring and reporting, historical reports can be downloaded as Excel files, or sent through the API into CRM, ERP and reporting tools such as Data Studio. Product teams rarely log into a contact center platform.
CRM and e-commerce integrations also put order details in front of the agent during the call, which makes it easier to tie each complaint to a specific item. That setup is central to how Call Center Studio supports ecommerce contact centers.
Close the loop
- Tell agents what changed. When a size chart is corrected, update the script so agents recommend the right size.
- Reach customers who already bought. If a defect is confirmed, a message to recent buyers can prevent the next wave of calls. Proactive support over WhatsApp fits well here.
- Check the trend after the fix. A drop in fit complaints on that style is the evidence you bring to the next cross-functional meeting.
See What Your Return Calls Are Already Telling You
Your return calls have been recorded for months. The patterns are already in them. What’s missing is a way to find them without listening to every call.
Book a demo to see how Call Center Studio’s customer experience analytics turns return conversations into reports your product and merchandising teams will actually use.
FAQ
What are retail return call insights?
Retail return call insights are the patterns hidden in customer calls about returns, such as recurring defects, sizing problems, and misleading product listings. They show why customers return products, not just how many returns happen.
Why do return calls matter for product and merchandising teams?
Return calls capture the exact reason behind a return, like “it runs small” or “the color looked different online.” Wrap-up codes and return forms rarely record this, so the product problem stays invisible without call analysis.
How can a contact center analyze return calls at scale?
Automated interaction analytics reviews every call, email, and chat instead of a small QA sample. CX Insights uses AI to group conversations by topic, solution, and sentiment, so spikes in defect or fit complaints show up early.
How do you share return call data with product teams?
Send each team a short summary with the SKU, the issue, the volume, and a few customer quotes. Call Center Studio reports can be downloaded as Excel files or sent through the API to CRM, ERP, and reporting tools.