

Every call center runs on the same uneasy trade-off. Answer fast enough to keep customers happy, but not by staffing so heavily that costs spiral. Lean too far either way and you pay for it, in churn on one side, or payroll on the other.
Workforce Optimization for Call Centers is how you manage that balance instead of guessing at it. WFM (workforce management) software is what makes it practical at scale.
Both come down to three metrics: Service Level, Occupancy & FCR.
- Service level shows how fast customers reach an agent.
- Occupancy rate shows how hard agents work between calls.
- FCR shows whether the call solved anything.
This guide covers what each metric means, how to calculate them, and how WFM software keeps all three in balance.
The Pillars of Call Center Efficiency: Service Level, Occupancy & FCR
These three metrics don’t operate in isolation. Move one and you shift the others. That’s what makes them a system rather than a checklist.
Consider a common scenario. Call volume spikes, and service level drops. The instinctive fix is to eliminate breathing room between calls. Service level recovers — but occupancy climbs to 95%, and within weeks you’re dealing with agent burnout, errors, and rising attrition. The dashboard looked better while the operation got worse.
The reverse is equally costly. Staff up aggressively, bring occupancy down to a comfortable 75%, and service level holds. But cost per call jumps, and finance will notice.
FCR connects the two from underneath. Low resolution rates mean the same customers call back two or three times, artificially inflating your volume. You’re not busy because demand is high. You’re busy because last week’s calls didn’t stick. Improve FCR, and a portion of your queue disappears, relieving pressure on service level and occupancy at the same time.
🚩 Quick Reference: Healthy Ranges at a Glance
- Service level: 80% of calls answered within 20 seconds (industry-standard 80/20 benchmark)
- Occupancy rate: 85%–90% sustainable operating range
- FCR: Industry average ~70%; strong performers meaningfully above that line
Managing Service Level, Occupancy & FCR as a connected system is how small improvements compound into significant operational gains. The next three sections break each metric down, covering what it measures, how to calculate it, and where the danger zones are.
What is Service Level and How to Calculate It?
Service level answers the question every customer implicitly asks: how long am I going to wait? It is the percentage of incoming calls answered within a defined time threshold.
The industry benchmark is the 80/20 rule: 80% of calls answered within 20 seconds.
That’s a convention, not a law. High-priority support queues may run 90/15. Lower-priority channels may accept 70/30. Outbound-heavy operations and digital-first brands often apply different thresholds entirely.
The exact origin of the 80/20 standard is disputed — some trace it to early AT&T research, others to Rockwell’s call center systems in the 1970s.
What that research most likely captured was abandonment behavior: callers began hanging up at around the 20-second mark, not necessarily because satisfaction dropped, but because silence felt like no one was there.
Whatever its roots, the standard stuck because it represented a reasonable balance between speed and staffing cost for most inbound operations.
Today, that threshold should be revisited against your own CSAT data.
But it remains the most widely used baseline for benchmarking and vendor comparisons.
What matters most is having a defined target and holding the operation to it consistently.
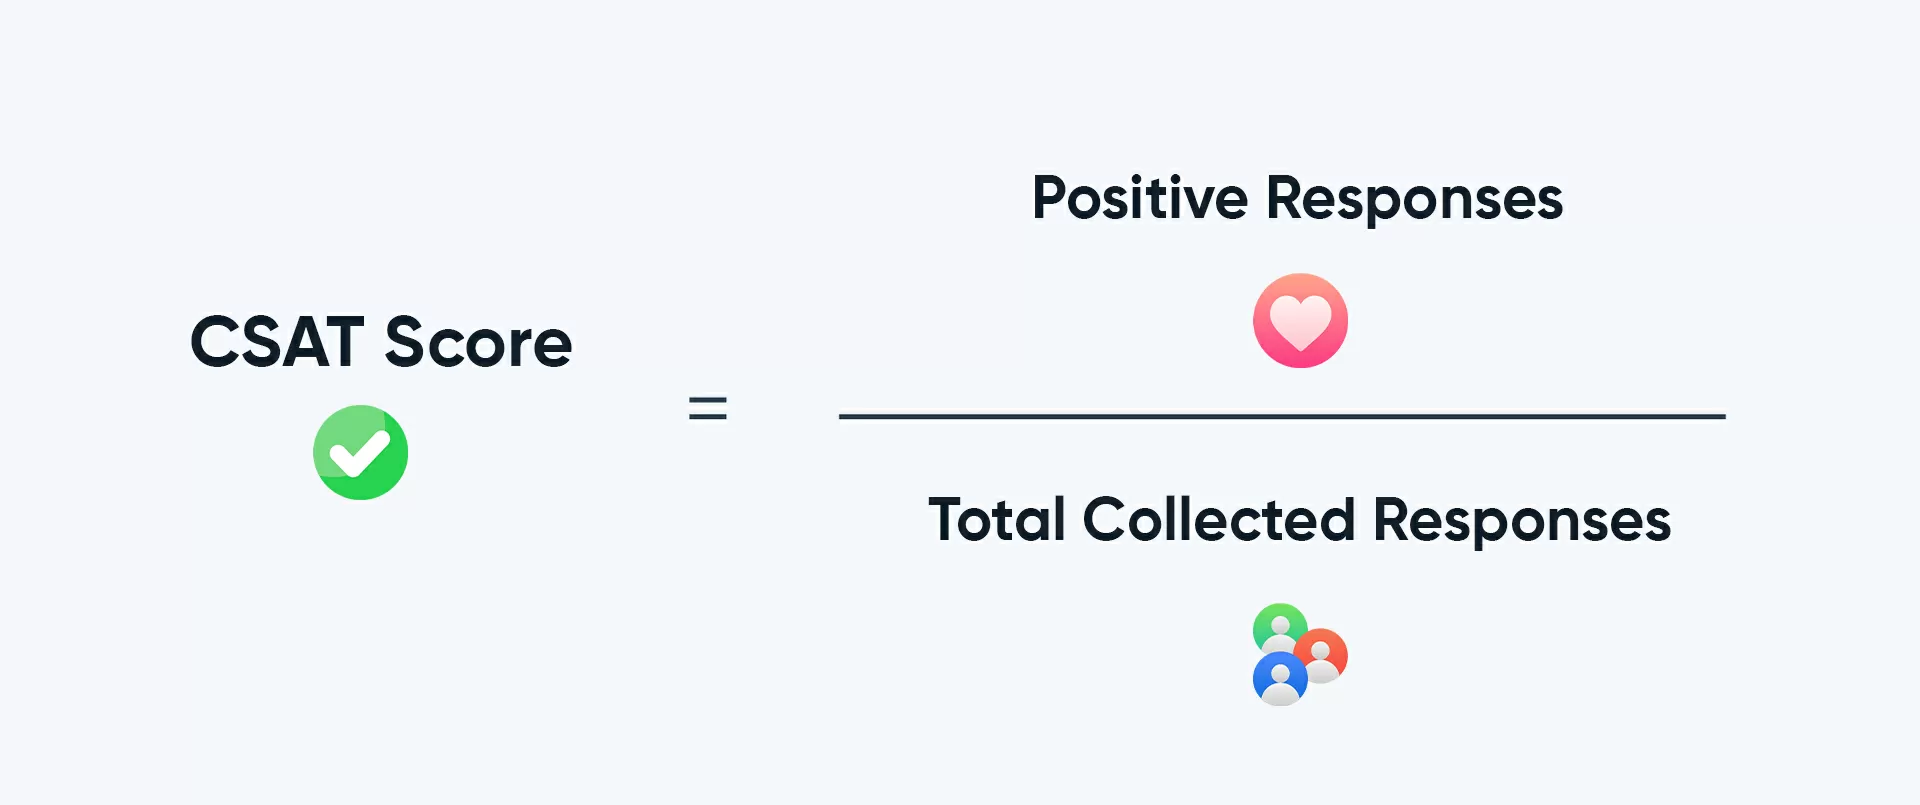
Here is the formula to calculate service level:
Service Level (%) = (Answered Calls within X Seconds ÷ Total Calls Received) × 100
A concrete example: 500 calls arrive in one hour, and 420 are answered within the 20-second threshold.
420 ÷ 500 = 0.84 → 84% service level
Before relying on that number, three setup decisions will significantly affect it:
- Abandoned calls: Most operations exclude calls abandoned within the threshold window. The logic is that if a customer hung up before the threshold expired, they were not negatively impacted by wait time. Include all abandons and the metric looks worse; exclude them entirely and you risk overstating performance.
- The threshold itself: Shifting the target from 20 to 30 seconds improves the score without improving the customer experience by a single second. Pick a threshold and hold it steady.
- The measurement window: A clean daily average can hide a brutal 12-to-1 p.m. stretch where service level collapsed to 50%.
Short intervals (15 or 30 minutes) reveal the problems that daily averages mask. The whole reason to calculate service level regularly is to catch problems while there’s still time to act. A smooth aggregate hides bad hours.
One more thing worth noting: there’s a ceiling on how much service level is worth chasing. Moving from 80/20 to 95/10 sounds like an upgrade, but the staffing cost is steep. Each extra point near the top requires disproportionately more idle agents, pulling occupancy down and inflating cost per call.
Most customers can’t distinguish 12 seconds from 20. They absolutely notice the difference between 20 seconds and two minutes. Set the target where customers actually feel it, then stop spending to beat it.
It’s also worth measuring service level by queue, not just overall. A blended 80% figure across all queues can mask a technical support queue running at 55% while a billing queue sits at 95%. Customers in those queues have entirely different experiences.
Segmenting service level by queue type, customer tier, or channel gives operations leaders the resolution to act on the right problem, rather than averaging away a real gap.
Now that service level is defined and calculated, the focus shifts to the people behind those calls.

Maximizing Agent Productivity: Understanding Occupancy Rate
Where service level looks at the customer’s experience, occupancy rate looks at the agent’s. It measures how much of an agent’s logged-in time is spent actually handling contacts, talk time, hold, and after-call work (ACW) such as notes and disposition codes, versus sitting available and waiting for the next call.
The formula:
Occupancy (%) = (Total Handle Time ÷ Total Logged-in Time) × 100
An agent logged in for 8 hours who spends 6.8 of them on contact-related work carries an occupancy rate of 85%.
One critical clarification before reading that number: occupancy and utilization are not the same thing, and confusing them breaks your staffing math.
- Occupancy = busy time ÷ logged-in time
- Utilization = logged-in time ÷ full paid shift (which includes breaks, training, and meetings)
The same agent can show 88% occupancy and 70% utilization in the same week. Reporting one and acting on the other produces scheduling errors that are difficult to trace back to their root cause.
The healthy operating range is 85% to 90%. Below that band, you’re paying for idle capacity. Above it, you’re heading into burnout territory, and the costs are real.
At 90% occupancy, an agent gets roughly six minutes of unoccupied time per hour.
There’s no recovery window between a difficult call and the next one.
Sustained over weeks, that’s the profile of an agent who starts making more errors, takes more sick days, and eventually quits.
Replacing and retraining a single agent costs $6,000 to $20,000 — and up to $35,000 when lost productivity is fully factored in, according to industry research from QATC and Frost & Sullivan.
That figure dwarfs whatever productivity was gained by pushing occupancy to 95%.
There’s also a diagnostic signal embedded in this metric. A very high occupancy rate almost always reflects understaffing, not exceptional productivity. If agents are consistently at 94%, you almost certainly don’t have enough of them, and that same shortage is likely dragging down your service level simultaneously.
High occupancy and low service level appearing together is one of the clearest staffing-gap signals in the data. When you see them paired, the answer is rarely a coaching conversation. It’s a headcount or scheduling problem.
Levers for bringing occupancy back into range fall into two categories: capacity and handle time.
On the capacity side, the fastest lever is schedule optimization. Staggering shift starts to match peak periods, distributing breaks away from high-volume windows, and adding part-time coverage for predictable spikes can each recover 3–5 occupancy points without increasing payroll.
On the handle time side, reducing after-call work (ACW) is often faster than reducing talk time. Structured disposition codes, auto-populated call summaries, and CRM integration that logs interactions automatically can each cut 30–60 seconds per call. Across a full day’s volume, that’s a meaningful reduction in occupancy without touching a single schedule line.
With occupancy defined, the natural next question is whether the calls that got answered actually resolved anything.
First Contact Resolution (FCR): The Ultimate Quality Metric
Service level and occupancy measure speed and effort. FCR measures outcome. It is the percentage of customer issues resolved in a single interaction, no callback, no escalation, no “I’ll need to transfer you.”
The formula:
- FCR (%) = (Issues Resolved on First Contact ÷ Total First Contacts) × 100
Measuring it accurately takes more care than calculating it. The two standard approaches are post-call surveys and repeat-contact tracking, checking whether the customer reached out again about the same issue within a set window, typically a few days. Surveys tend to be more reliable. A customer who doesn’t call back isn’t necessarily satisfied. Sometimes they’ve simply stopped trying.
FCR earns its reputation as the key quality metric because it moves almost everything else in the operation.
FCR by the Numbers (SQM Group Research)
- Industry average FCR: ~70%
- 49% of call centers operate below the 70% FCR threshold.
- Every 1% improvement in FCR → ~1% reduction in operating costs
- Every 1% improvement in FCR → ~1% improvement in customer satisfaction (CSAT)
- For an average midsize call center, a 1% FCR gain is worth approximately $286,000 in annual savings
- 93% of customers expect their issue resolved on the first contact
Every unresolved issue becomes a repeat contact. That return call arrives from a customer who is already frustrated, consumes agent capacity you’ve already paid for, and artificially inflates queue volume. Improving FCR doesn’t just lift a quality score, it directly reduces the demand that’s straining your service level and occupancy.
When FCR is stuck below the 70% average, the root cause is almost always structural, not individual. The most common drivers:
- Fragmented customer history: Agents ask for information the customer already provided because context isn’t surfaced across channels or previous interactions.
- Misaligned routing: Calls land with whoever is available, not with whoever can actually solve the issue. The right agent for the problem is often sitting one queue over.
- Insufficient agent authority: Agents recognize the solution but can’t execute it without escalating to a manager, adding transfer time and risking a dropped resolution.
None of these are solved by telling agents to try harder. They are solved at the system level, through better data integration, smarter routing, and the right operational tooling.
The operational levers for improving FCR are equally structural:
- Unified customer context: Surface interaction history across channels so agents enter the call already knowing what happened. A customer who called yesterday about the same issue shouldn’t have to explain it again.
- Intent-based routing: Match calls to agents based on skills, product knowledge, and case history, not just availability. A billing dispute routed to a retention specialist closes faster than the same call hitting a general queue.
- Expanded agent authority: Define a clear resolution boundary and empower agents to work within it without escalation. Every unnecessary transfer is a potential unresolved contact.
- Real-time knowledge assist: AI tools that surface relevant policies, troubleshooting steps, or account notes during the call reduce reliance on hold time and supervisor consultation.
Addressing these systematically is how organizations move FCR from 65% to 75% without adding headcount. That’s where workforce management software enters the picture.
Multiple Quick Wins: How WFM Software Bridges the Gap
Manual calculations tell you what happened. WFM software tells you what is happening and what to do about it before the queue backs up.
The platform operates across two timeframes: before the shift starts, and during it.
Forecasting: Getting Staffing Right Before the Phones Ring
Forecasting is the planning layer. WFM software reads historical contact data, volumes by hour, day, and season, and projects incoming demand.
It then converts that demand into a precise staffing requirement: exactly how many agents are needed in each interval to hit your service level target without pushing the occupancy rate past its healthy ceiling.
In practice, that looks like this:
A forecast of 1,200 calls between 10 and 11 a.m. triggers a calculation: 22 agents need to be available to hold 80/20 at a sustainable occupancy. The schedule is built with that number on the floor, breaks and shrinkage already factored in.
This is the highest-leverage capability the software provides, because most service level and occupancy problems are scheduling problems in disguise.
Get the forecast right and both metrics largely manage themselves. Get it wrong by 10% and you spend the whole shift reacting to a gap that was baked in before anyone logged on, often at the cost of overtime pay, elevated abandonment rates, and avoidable escalations.
Poor forecasting accuracy is a leading driver of unplanned overtime in contact centers. The forecast doesn’t need to be perfect, but it needs to be within a few percent. Manual spreadsheet forecasting rarely gets there reliably across seasonal and weekly variation.
Good forecasting also accounts for the patterns a human planner misses:
- Monday volume spikes and mid-week dips in recurring weekly cycles
- Post-marketing-email call surges (typically arriving 1–2 hours after a campaign send)
- Seasonal traffic shifts and event-driven volume anomalies
- Shrinkage: training sessions, scheduled breaks, sick time, and planned leave
Intraday Management: Fixing Problems While They’re Still Small
Forecasts are never perfect. A product outage, a viral complaint, or unexpected no-shows don’t appear in last year’s data. Intraday management is the real-time layer that handles the day as it actually unfolds.
A WFM platform continuously monitors live metrics against target. The moment occupancy climbs past 90% or service level dips below threshold, it flags the deviation, while corrective action is still possible, not the next morning in a performance report.
To make this concrete: say a product issue generates an unexpected call surge at 11 a.m. Service level drops to 65% within 15 minutes. The platform alerts the supervisor in real time. From there, the response options are immediate and specific:
- Shift a scheduled break by 15 minutes to increase available capacity
- Redirect agents from email or chat queues back to the voice channel
- Offer voluntary overtime to agents already logged in
- Move a non-urgent training block out of the high-volume window
Any one of those adjustments, made within the first 10 minutes of the spike, can prevent a full-hour service level breach. The same situation handled reactively, noticed at end-of-day in a report, has no fix.
This is where Service Level, Occupancy & FCR finally get managed as the connected system they are. The platform watches all three simultaneously, so a fix that protects one doesn’t quietly damage another. In a CCaaS (Contact Center as a Service) setup, these adjustments can be made across channels and locations from a single screen, which is a primary driver behind enterprise migration to cloud-based contact center platforms.
There’s a second-order benefit worth naming. When occupancy stays in its healthy band, agents carry less stress and are far less likely to leave. Experienced agents resolve issues on the first try at a much higher rate than new hires still learning the product. The schedule built to protect today’s service level is also quietly protecting next quarter’s FCR.
The operational improvements compound quickly: schedules that hit service level from the first build, occupancy held in its sustainable range, supervisors alerted before a bad hour rather than after it, and fewer repeat calls clogging the queue because FCR is being tracked and addressed in real time.
Elevate Your Call Center Performance!
Service level, occupancy rate, and FCR are not three separate scorecards. They are three views of the same operation, and they pull against each other constantly.
Chase speed by overworking agents and you trade occupancy and retention for it. Push occupancy too high and customers wait. Ignore FCR and the same calls keep coming back, undoing whatever progress you made on the other two.
That is the real case for Workforce Optimization for Call Centers: not a better number on a single metric, but all three held in balance at once.
You can do the arithmetic by hand. Calculating Service Level, Occupancy & FCR requires a spreadsheet and a few minutes.
What you cannot do manually is react fast enough, forecast accurately enough, and maintain that balance through a volume spike at 2 p.m. on a Tuesday.
That is the job WFM software does. It forecasts demand before the shift, watches the metrics live during it, and flags problems while you can still fix them.
🚩 Ready to stop reacting and start optimizing? See how an AI-driven WFM platform manages your Service Level, Occupancy & FCR in real time. Book your free demo today!