
Today, data is at the heart of customer experiences. However, raw data without context is merely noise. That is why modern enterprises are leveraging advanced analytics to decode every single customer touchpoint to stay competitive.
Our comprehensive guide explores how advanced analytics in your reporting, key performance indicators (KPIs), and quality management workflows can transform your contact center into a powerful engine for customer loyalty and revenue growth.
1.Moving Beyond Basic Call Tracking to Deep Insights
Traditional call centers focused almost exclusively on basic quantitative metrics like:
- How many calls came in?
- How long did they last?
- How many were dropped?
While these operational metrics are necessary, they only tell a fraction of the story. Because they measure volume, not value. They track the speed of an interaction, but completely miss its emotional or qualitative outcome.
The transition from a siloed call center to an integrated contact center requires an organizational shift toward comprehensive contact center analytics. Simply because customer interactions are not linear anymore. For instance, a customer might start by browsing a self-service FAQ, initiate a live chat on a mobile app, and finally place a phone call to resolve a complex billing issue.
These interactions are treated as disconnected events without omnichannel contact center analytics. But when you implement advanced analytics platforms, you can stitch these fragmented touchpoints into a unified customer chronicle. Such a holistic view allows operations managers and executives to understand:
- The underlying root causes of customer frustration
- Discover hidden drop-off points in the digital journey, and
- Predict future behavior.
Furthermore, the benefits of contact center analytics extend far beyond the customer service department; they provide product, marketing, and sales teams with direct, unfiltered feedback from the front lines, turning operational data into enterprise-wide business intelligence.
2.Decoding Contact Center Analytics Software: Features & Capabilities
Thanks to cloud computing and advanced natural language processing (NLP), modern analytics provide massive insight by parsing, tagging, indexing, and analyzing interactions in real time. In order to capture and interpret the massive influx of unstructured data generated daily, companies must deploy a robust contact center analytics software ecosystem.
You may ask, what kind of ecosystem is that, then? An enterprise-grade analytics solution is built upon several foundational components:
- Multi-Channel Data Connectors: These ingest structured data (call logs, CRM records) and unstructured data (voice recordings, chat transcripts, emails) seamlessly across all communication vectors.
- Speech and Text Processing Engines: Transcription systems convert acoustic voice data into highly accurate text formats, laying the groundwork for algorithmic analysis.
- Artificial Intelligence and Machine Learning Layers: Predictive models and categorization algorithms automatically sort interactions by topic, intent, and compliance risk.
- Unified Visualization Dashboards: Role-based interfaces that translate complex data sets into actionable charts, graphs, and heatmaps for supervisors and executives.
By utilizing these core features, companies can leverage automated quality monitoring to evaluate every single interaction instead of a tiny fraction. This comprehensive oversight ensures that compliance anomalies, script deviations, and exceptional agent performances are flagged immediately, rather than weeks after the fact.
Why Legacy Systems Fail in the Era of Big Data
Many organizations still attempt to generate insights using legacy on-premise reporting modules built directly into their old Automatic Call Distribution (ACD) systems. These legacy architectures fail because they were designed for an era when voice was the sole medium and data storage was expensive. They operate in rigid silos, meaning chat data sits in one application, emails in another, and voice recordings on a separate, hard-to-access physical server.
Furthermore, legacy reporting is notoriously slow and inflexible. Customizing a report often requires specialized IT assistance or external vendor intervention, resulting in weeks of delay. By the time a supervisor identifies a systemic drop in customer satisfaction or an operational bottleneck, the damage to the brand’s reputation has already been done.
In contrast, cloud-native best contact center analytics tools process millions of data points concurrently, allowing leaders to run complex cross-channel queries and modify operational workflows instantly to meet shifting demands.
3.The Power of Text & Speech Analytics in Quality Management
Voice remains one of the most critical and emotionally charged channels in customer service. However, because voice data is inherently unstructured, extracting value from it historically required manual human intervention. The introduction of advanced speech analytics in contact center ecosystems has completely changed this paradigm.
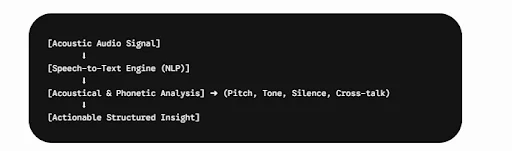
Modern speech analytics solutions process acoustic signals through two primary methods:
- Phonetics-based systems and
- Speech-to-text (transcription) systems.
Phonetics-based engines analyze the raw sound waves for specific phoneme sequences, making them incredibly fast at identifying specialized keywords or brand names. Speech-to-text systems convert the entire audio file into a written transcript, which can then be analyzed using advanced NLP.
Crucially, speech analytics looks beyond the literal words spoken. It measures acoustic characteristics such as pitch, volume, speaker velocity, periods of extended silence, and instances of cross-talk (where the agent and customer speak over one another). If a customer’s pitch rises sharply or if there is a 15-second block of silence, the system automatically flags the call for review, allowing supervisors to pinpoint exactly where an interaction went off the rails.
Sentiment Analysis: Reading Between the Lines of Customer Interactions
Understanding what a customer wants is good; understanding how a customer feels is transformative. This is where sentiment analysis call center features become indispensable. Sentiment analysis uses machine learning models trained on millions of conversational examples to assign an emotional score (typically positive, neutral, or negative) to every phrase, sentence, and overall interaction.
Example:
“Your software is completely broken!” ➔ [Negative Sentiment Category]
“Thank you, that actually fixed the issue.” ➔ [Positive Sentiment Category]
By tracking sentiment trends, organizations can spot macro-level shifts in customer perception. For example, if a specific software update introduces a bug, sentiment analysis tools will register a sudden surge in negative sentiment tied to keywords like “login” or “error code.”
On a micro level, tracking sentiment shifts within a single call provides clear indicators of agent efficacy. A call that begins with highly negative sentiment but concludes with positive sentiment demonstrates exceptional conflict resolution and de-escalation skills by the agent. Conversely, a call that deteriorates from neutral to highly negative reveals a breakdown in rapport that requires targeted coaching.
Text Analytics Across Digital Channels (Chat, Email, Social)
While voice analytics captures the nuances of spoken dialogue, digital channels require a parallel discipline: text analytics. As customers increasingly turn to live web chat, WhatsApp, SMS, and public social media platforms, the volume of written interaction data has surpassed traditional voice channels in many industries.
Advanced interaction analytics platforms normalize text data from these disparate digital channels into a single standardized format. Text analytics applications scan these digital streams for structural patterns, stylistic nuances, emojis, and punctuation choices (such as excessive capitalization or exclamation marks) to assess urgency and intent.
By analyzing digital interactions at scale, companies can identify systemic flaws in their self-service bots or web interfaces. For instance, if text analytics reveals that hundreds of customers are chatting with live agents because they cannot locate the “reset password” button on the portal, UX designers can immediately implement a fix, permanently reducing chat volumes.
4.Transforming Call Center Quality Assurance (QA) Frameworks
Traditional call center quality management is fundamentally limited by human scale. In a typical manual QA framework, a dedicated evaluator listens to three to five random call recordings per agent per month. They fill out a static scorecard, checking boxes for compliance, greeting quality, and script adherence.
This manual approach suffers from three critical flaws:
- Statistical Insignificance: Evaluating 5 out of 500 calls means that 99% of an agent’s performance is completely unmonitored. A great agent might be penalized for one unusually difficult call, while an underperforming agent might get lucky during their evaluated sample.
- Inherent Subjectivity: Different human evaluators bring personal biases to scorecards. What one auditor considers “empathetic,” another might mark as “unprofessional.”
- Lagging Feedback Loops: QA scores are often delivered weeks after the actual interactions occurred, making it incredibly difficult for agents to recall the context or correct bad habits in real time.
| Evaluation Metric | Manual QA Framework | Automated Analytics QA |
| Sample Size | 1% – 2% of total calls | 100% of all interactions |
| Objectivity | Subject to auditor bias | Algorithmic, standardized scoring |
| Feedback Latency | Weeks after the interaction | Near real-time or immediate |
| Compliance Risk | High (missed violations) | Low (every infraction flagged) |
Transitioning to automated quality monitoring allows systems to evaluate 100% of all interactions across voice and text channels instantly. The software automatically scores foundational items—such as verifying identities, reciting mandatory disclosure statements, and checking for appropriate brand greetings—freeing human QA professionals to focus their energy on deep, nuance-driven coaching sessions.
How to Improve Call Center Quality Management for Remote Agents
The widespread adoption of remote and hybrid work models has added layers of complexity to team management. Supervisors can no longer walk the contact center floor, overhear escalating situations, or provide casual, desk-side feedback. In this decentralized environment, analytics software acts as a supervisor’s virtual eyes and ears.
To understand how to improve call center quality management for distributed workforces, organizations must leverage granular agent performance analytics. By aggregating productivity data, desktop activity logs, and interaction sentiment scores, managers can build a comprehensive digital twin of an agent’s daily output.
Plus, advanced dashboards can automatically alert a supervisor if a remote agent’s average handle time spikes sharply across consecutive calls, or if their sentiment scores suddenly drop. This real-time visibility ensures that isolated remote workers receive prompt support, tailored training interventions, and objective, data-driven performance reviews that eliminate proximity bias entirely.
5. Mastering Contact Center Reporting: Real-Time vs. Historical Data
Real-Time contact center reporting provides supervisors and workforce management (WFM) teams with an instant, live snapshot of current operational realities. What real-time analytics tools do is to monitor active queues, current wait times, service level agreements (SLAs), and ongoing agent states (e.g., in-call, wrap-up, on break). Also, advanced systems feature live anomaly detection that triggers proactive notifications when specific thresholds are breached.
For example, if the system notices that thirty customers are simultaneously waiting in a specific technical support queue while twenty agents are currently stuck in prolonged “after-call work” (ACW) states, supervisors can step in instantly. They can reallocate blended digital agents to the voice queue, send rapid support messages to struggling reps, or adjust interactive voice response (IVR) messaging dynamically to mitigate hold times.
Historical Reporting: Identifying Long-Term Trends and Bottlenecks
While real-time dashboards are essential for day-to-day firefighting, historical reporting call center systems are critical for building long-term corporate strategy, predicting capacity needs, and discovering systemic operational bottlenecks. Historical reports aggregate data across weeks, months, or quarters to highlight macro trends that are invisible in short windows.
Through deep historical analysis, operational leaders can run complex correlation models. They can determine, for instance, whether onboarding training variations across different hiring classes impact customer retention over a six-month period. Historical reporting also reveals seasonal call patterns, enabling workforce planners to optimize staffing matrices, schedule training when call volumes are historically low, and build highly accurate budget forecasts for the upcoming fiscal year.
Contact Center Reporting Best Practices
To prevent enterprise stakeholders from drowning in data while starving for insight, organizations must establish structured reporting frameworks. Implementing contact center reporting best practices involves several core pillars:
- Define Audience-Specific Dashboards: Executives require high-level financial and satisfaction trends (ROI, customer lifetime value, overall CSAT). Supervisors need tactical operational metrics (agent utilization, queue compliance, current SLAs). Agents require individualized, self-service performance portals to track their personal progress against team averages.
- Contextualize Quantitative Metrics with Qualitative Insights: Never present a numeric report in isolation. A sudden increase in average call duration should always be paired with text analytics data explaining why calls were longer (e.g., a major billing system migration or a product recall).
- Automate Report Distribution: Schedule automated, multi-channel reports to ensure key stakeholders receive consistent updates without manual administrative effort.
- Establish Clear Action Triggers: Ensure every report has pre-defined operational responses. If a specific metric drops below a set baseline, the organization must have a clear playbook ready to execute immediately.
6. The Ultimate Contact Center KPIs & Metrics Playbook
To successfully manage a modern customer service operation, leaders must balance efficiency-focused operational metrics with value-focused customer experience indicators. Below is the definitive playbook for modern call center KPIs, broken down by category.
Operational Metrics: Optimizing AHT and FCR
1. First Contact Resolution (FCR)
- Definition: The percentage of customer issues resolved completely during their very first interaction, requiring no follow-up contacts.
- How Analytics Tracks It: Traditional systems rely on manual agent tagging or retroactive post-call surveys, both of which are highly inaccurate. Advanced analytics platforms track first contact resolution by automatically matching customer IDs, phone numbers, and emails across all channels within a rolling 7-to-14-day window. If the same customer reaches out again regarding similar topics, the system flags the initial interaction as an FCR failure.
- Optimization Strategy using Analytics: By applying text and speech analytics to failed FCR interactions, companies can isolate the specific phrases or complex troubleshooting steps that frequently cause follow-up calls. Leaders can then redesign IVR routing paths to ensure these complex issues are directed exclusively to specialized tier-2 agents, or update internal knowledge bases to provide clearer guidance.
2. Average Handle Time (AHT)
- Definition: The average duration of a customer transaction from the moment they connect with an agent until the completion of all post-call administrative tasks.
- AHT = {Total Talk Time + Total Hold Time + Total After-Call Work } Total Number of Calls
- How Analytics Tracks It: Analytics software splits AHT into three distinct sub-components: talk time, hold time, and after-call work (ACW) duration. Desktop analytics tools go a step further, mapping exactly what applications the agent clicked on during hold periods or ACW states.
- Optimization Strategy using Analytics: Instead of pressuring agents to rush customers off the phone (which destroys satisfaction), managers should analyze Average Handle Time (AHT) optimization through the lens of friction. If desktop analytics reveals that long ACW times are caused by agents manually copying and pasting data between three legacy systems, the company can deploy automated integration scripts to eliminate that manual overhead entirely, reducing AHT naturally.
Customer-Centric Metrics: CSAT, CES, and NPS Tracking
1. Customer Satisfaction (CSAT)
- Definition: A metric that measures a customer’s immediate satisfaction with a specific interaction or transaction, typically captured via a post-call scale (e.g., 1–5).
- How Analytics Tracks It: Traditional surveys suffer from notoriously low response rates (often under 5%), usually attracting only highly angry or highly delighted customers. Advanced Customer Satisfaction (CSAT) analytics utilizes predictive machine learning algorithms to evaluate 100% of interactions. By analyzing conversation sentiment, resolution indicators, and acoustic data, the system calculates a Predictive CSAT score for every customer, regardless of whether they filled out a manual survey.
- Optimization Strategy using Analytics: When the predictive model flags an interaction with a low score, the system can automatically route that specific customer file to a specialized customer retention team for proactive outreach before the customer decides to churn.
2. Customer Effort Score (CES)
- Definition: A metric evaluating how easy it was for a customer to get their issue resolved or their question answered.
- How Analytics Tracks It: Systems look for explicit friction indicators within speech transcripts and text streams, such as phrases like “I’ve called three times,” “Your website isn’t working,” or “Can you repeat that?”
- Optimization Strategy using Analytics: By aggregating these friction points, operations teams can identify where self-service systems are failing, allowing them to optimize digital touchpoints and streamline complex authentication processes.
3. Net Promoter Score (NPS)
- Definition: A long-term relationship metric that measures a customer’s overall brand loyalty and willingness to recommend the company’s products or services to others.
- How Analytics Tracks It: Correlation engines connect transactional contact center data (such as an individual’s historical hold times and FCR rates) directly with annual loyalty surveys.
- Optimization Strategy using Analytics: This cross-referencing allows companies to see the direct financial impact of operational metrics on long-term customer loyalty, proving the exact return on investment (ROI) of contact center technology upgrades.
Designing the Perfect Dashboard
To drive organizational change, these metrics must be visualized effectively. When building your system architecture, reference clear contact center dashboard examples to ensure your interface is clean, uncluttered, and structured for rapid decision-making.
An optimized dashboard should never force a user to hunt for information. The most critical operational health indicators should be front and center, with clear color-coded thresholds (Green for optimal, Yellow for caution, Red for critical breach) that instantly guide a supervisor’s attention to where it is needed most.
Transform Your Contact Center Insights into Action with Call Center Studio
Building a data-driven contact center requires a technology foundation that can handle modern, omnichannel customer journeys seamlessly. Traditional setups often trap your data in silos, leaving you in the dark when it comes to true operational performance and customer sentiment.
Call Center Studio bridges this gap with its cloud-native, enterprise-grade infrastructure. Built on Google Cloud, Call Center Studio offers robust AI and natural language processing features, real-time analytics dashboards, and seamless cross-channel integrations that empower operations managers to:
- Track and optimize critical KPIs like FCR and AHT instantly.
- Monitor 100% of interactions with advanced speech and text analytics.
- Deploy flexible, remote-ready QA frameworks that eliminate performance biases.
- Bridge the gap between real-time issues and long-term historical reporting.
Don’t let valuable customer insights turn into noise. Take complete control of your data, boost customer loyalty, and scale your operations effortlessly.
Book a live demo with Call Center Studio today and see how the right cloud infrastructure can transform your contact center from a cost center into a powerful revenue engine.
Frequently Asked Questions (FAQ)
1. What is the difference between call center analytics and contact center analytics?
While traditional call center analytics focuses almost exclusively on voice channel metrics (such as call volume, drop rates, and call duration), contact center analytics tracks and unifies data across multiple channels. It stitches together a customer’s entire journey across voice, email, live chat, SMS, and social media into a single timeline, providing a holistic view of the customer experience.
2. Why is automated quality monitoring better than traditional manual QA?
Traditional QA is limited by scale, typically evaluating only 1% to 2% of an agent’s monthly calls, which introduces subjectivity and lagging feedback. Automated quality monitoring leverages AI and speech/text analytics to evaluate 100% of all interactions instantly. It provides objective scoring, identifies compliance risks in near real-time, and allows supervisors to focus on targeted, data-driven coaching.
3. How can contact center analytics help optimize Average Handle Time (AHT) without sacrificing customer satisfaction?
Instead of pressuring agents to rush off the phone, advanced analytics optimizes AHT by identifying and removing operational friction. By using desktop analytics and text/speech processing, software can uncover systemic issues—such as slow legacy systems, confusing internal knowledge bases, or clunky post-call wrap-up (ACW) workflows—allowing companies to automate these processes and reduce handle times naturally.